Motorcycle theft in Australia has recorded a drop of 3.6% in 2017 from 8335 to 8038 and down 3% on five years ago, mainly due to lower demand for motorcycles.
It’s good news for motorcyclists, yet it’s only half the drop of total vehicle thefts across the nation in the 12 months to December.
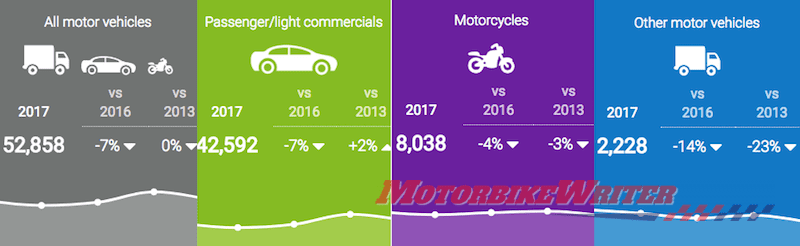
Some 52,858 vehicles were stolen in 2017, which was down 7%. Passenger cars and light commercials were also down 7% to 42,592, according to figures from the National Motor Vehicle Theft Reduction Council.
Council executive director Ray Carroll says the total vehicle decrease was largely the result of a significant fall in Victoria, down 21.7% from 19,572 to 15,332.
Motorcycle theft
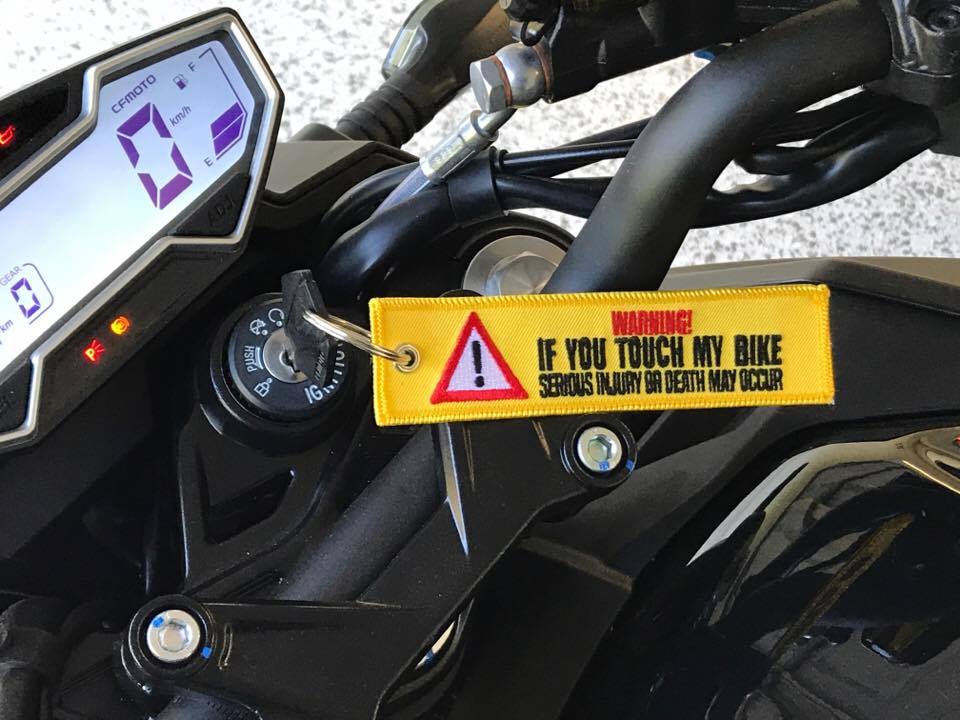 Buy your “warning” keyring now at the Motorbike Writer online shop.
Ray says the drop in motorcycle theft was a result of the decreasing demand for bikes in the wake of the mining downturn in WA.
The theft decrease also follows a significant 9.3% decline in motorcycle sales in 2017.
Biggest increase in bike theft was in NSW which was up 188 to 1673 (12.7%), while the biggest decrease was in Victoria down 250 to 2006 (-11.1%) followed by Western Australia down 220 (10.2%).
Victoria still accounts for the most motorcycle thefts at 2006 or exactly one-quarter of all bike thefts.
Five years ago, WA accounted for one in three motorcycle thefts in Australia, but it is now down to one in four (24.2%). However, it still accounts for the second-highest number of thefts.
Third is NSW, followed by Queensland with 1673, up 185 to 1673 or 12.7%.
Motorcycle theft 2016 to 2017
| State or Territory | 2016 | 2017 | % change | ||
|---|---|---|---|---|---|
| Thefts |
% of thefts
|
Thefts |
% of thefts
|
||
| ACT | 98 | 125 | 27.6% | ||
| NSW | 1,485 | 1,673 | 12.7% | ||
| NT | 127 | 125 | -1.6% | ||
| QLD | 1,487 | 1,525 | 2.6% | ||
| SA | 614 | 519 | -15.5% | ||
| TAS | 105 | 122 | 16.2% | ||
| VIC | 2,256 | 2,006 | -11.1% | ||
| WA | 2,163 | 1,943 | -10.2% | ||
| AUS | 8,335 | 100.0 | 8,038 | 100.0 | -3.6% |
Motorcycle theft 2013 to 2017
| State or Territory | 2013 | 2017 | % change | ||
|---|---|---|---|---|---|
| Thefts |
% of thefts
|
Thefts |
% of thefts
|
||
| ACT | 83 | 125 | 50.6% | ||
| NSW | 1,467 | 1,673 | 14.0% | ||
| NT | 170 | 125 | -26.5% | ||
| QLD | 1,466 | 1,525 | 4.0% | ||
| SA | 511 | 519 | 1.6% | ||
| TAS | 107 | 122 | 14.0% | ||
| VIC | 1,691 | 2,006 | 18.6% | ||
| WA | 2,813 | 1,943 | -30.9% | ||
| AUS | 8,308 | 100.0 | 8,038 | 100.0 | -3.2% |
Theft hot spots
Riders in South East Queensland and the Perth region are likely to be paying the most on insurance premiums as they are hot posts for motorcycle thieves.
Of the top 10 local authorities according to bike thefts, SEQ has half.
Motorcycle thefts by Local Government Areas
| State or Territory | LGA | 2016 | 2017 | % change |
|---|---|---|---|---|
| QLD | Brisbane (City) | 250 | 270 | 8.0% |
| QLD | Gold Coast (City) | 215 | 225 | 4.7% |
| VIC | Melbourne (City) | 184 | 176 | -4.3% |
| WA | Rockingham (City) | 127 | 145 | 14.2% |
| VIC | Port Phillip (City) | 134 | 139 | 3.7% |
| WA | Stirling (City) | 183 | 129 | -29.5% |
| QLD | Logan (City) | 126 | 127 | 0.8% |
| ACT | Greater ACT | 98 | 124 | 26.5% |
| QLD | Moreton Bay (Regional Council) | 143 | 116 | -18.9% |
| QLD | Sunshine Coast (Regional Council) | 62 | 111 | 79.0% |
Most stolen motorcycles
Honda sells the most bikes, so they always rate the highest with the other three Japanese models closely behind.
However, the fifth top seller, Harley-Davidson, is beaten to fourth place by KTM.
This is because thieves are more likely to take lower-capacity bikes and dirt bikes which are lighter and easier to steal.
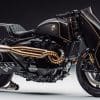
 Light KTM dirt bikes are easier to steal
Top motorcycle theft targets
| Make | 2016 | 2017 |
|---|---|---|
| Honda | 1,660 | 1,683 |
| Yamaha | 1,508 | 1,448 |
| Kawasaki | 830 | 726 |
| Suzuki | 742 | 721 |
| KTM | 485 | 548 |
| Harley Davidson | 232 | 208 |
| Piaggio | 162 | 174 |
| Hyosung | 215 | 171 |
| SYM | 151 | 167 |
| Triumph | 179 | 158 |
| Longjia | 166 | 129 |
| Husqvarna | 108 | 124 |
| Kymco | 129 | 110 |
| Ducati | 109 | 96 |
| TGB | 94 | 92 |
| Aprilia | 81 | 74 |
| Vespa | 87 | 73 |
| Vmoto | 83 | 73 |
| Adly | 93 | 72 |
| Bolwell | 69 | 72 |
Motorcycle thefts by cubic capacity
| Cubic capacity | 2016 | % of thefts | 2017 | % of thefts |
|---|---|---|---|---|
| 50 cc or less | 943 | 795 | ||
| 51 – 100 cc | 120 | 106 | ||
| 101 – 150 cc | 804 | 829 | ||
| 151 – 200 cc | 130 | 153 | ||
| 201 – 250 cc | 1,024 | 995 | ||
| 251 – 500 cc | 1,015 | 1,018 | ||
| 501 – 750 cc | 905 | 757 | ||
| 751 – 1000 cc | 455 | 427 | ||
| 1001 cc or more | 300 | 302 | ||
| Unknown | 2,639 | 2,656 |