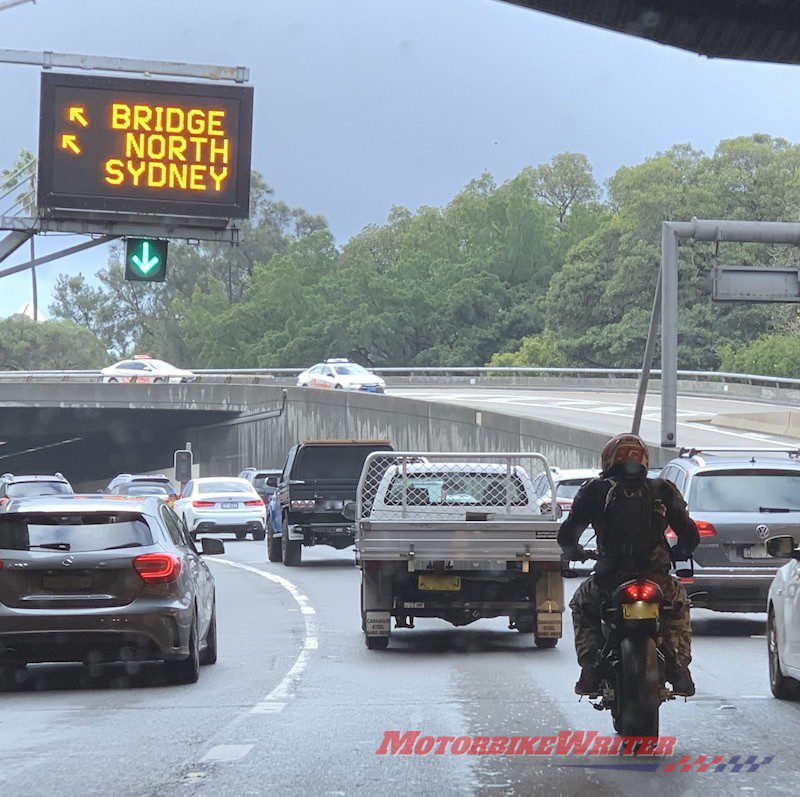
Aussie commuting traffic is fastest and safest in Perth and the worst in Sydney, according to a new statistical analysis of 100 major cities in the world.
The 2019 Driving Cities Index, commissioned by European car parts retailer Mister Auto, considers commuting traffic speeds, road condition, congestion, road rage, fatality rates, air pollution and costs such as parking and fuel.
Best commuting traffic
The best city for commuting traffic was Calgary in Canada, a country which had several cities in the top 10.
It was followed by Dubai, Ottawa, Bern and El Paso.
Perth was 13th, Brisbane 66th, Melbourne 83rd and Sydney 86th. Auckland in New Zealand was 49th.
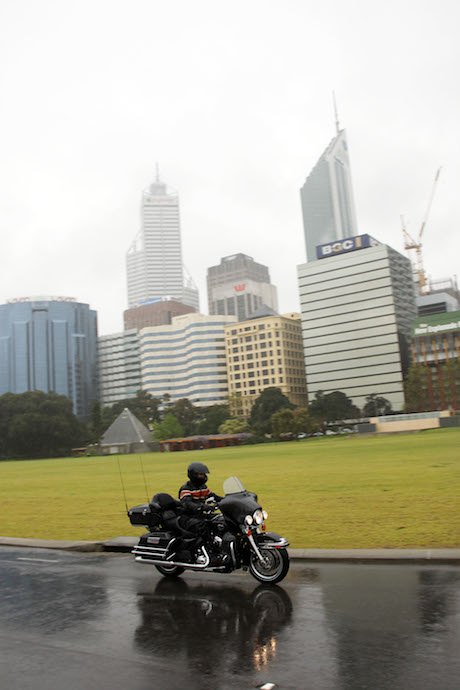 Perth commute is best even in the rain!
That is despite Melbourne rating much worse than Sydney for fatalities and road rage.
Canberra and Adelaide were not included as the study “focuses on the largest cities in each country”. However Mister Auto will “consider including these cities in expanded future iterations”.
Worst
Worst cities were mainly in Asia and Africa led by Mumbai in India followed by Ulaanbaatar in Mongolia, Kolkata in India and Lagos in Nigeria.
Results are similar to a 2017 German study of the world’s 100 major cities.
It rated Perth the best place in Australia for commuting at 19th, followed by Brisbane at 45th, Melbourne 55th, Adelaide surprisingly at 57th and Sydney worst 61st.
While lane filtering now allows riders to dodge the worst of the daily commute, riders still face commuting costs of fuel and parking, traffic crashes and road rage.
The Mister Auto survey found the state capital cities’ road conditions and fuel costs were the same rating them at 75th worst roads in the world and 78th for fuel costs.

Auckland was 27th for road conditions and 51st for fuel prices.
Other results, listed best to worst, include:
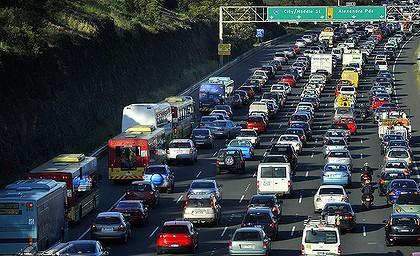 Melbourne traffic
Daily average congestion
- 13 Perth
- 28 Brisbane
- 43 Melbourne
- 44 Auckland
- 66 Sydney
Commuting speeds
- 11 Perth
- 20 Brisbane
- 58 Melbourne
- 68 Auckland
- 89 Sydney
Road rage
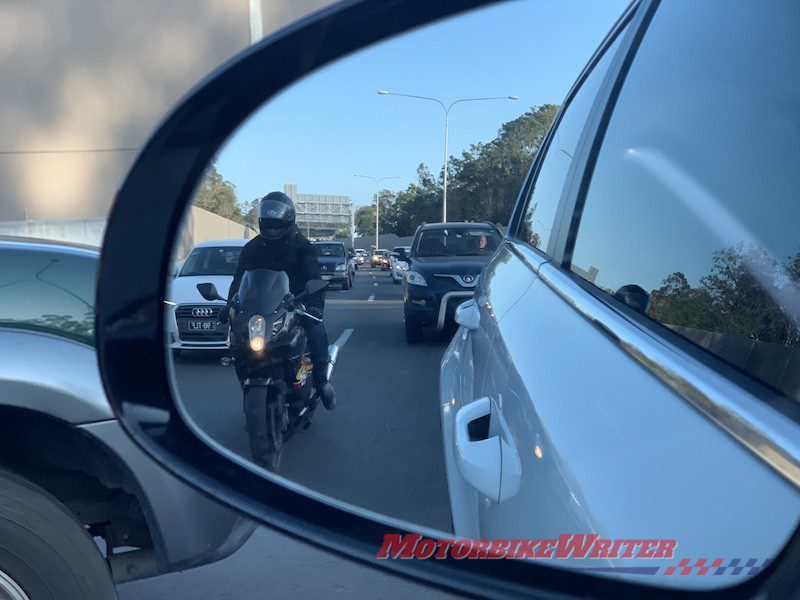 Brisbane traffic
- 17 Auckland
- 20 Brisbane
- 41 Perth
- 47 Sydney
- 50 Melbourne
Fatalities
- 33 Perth
- 40 Brisbane
- 42 Sydney
- 47 Auckland
- 71 Melbourne