(Contributed article for our North American readers)
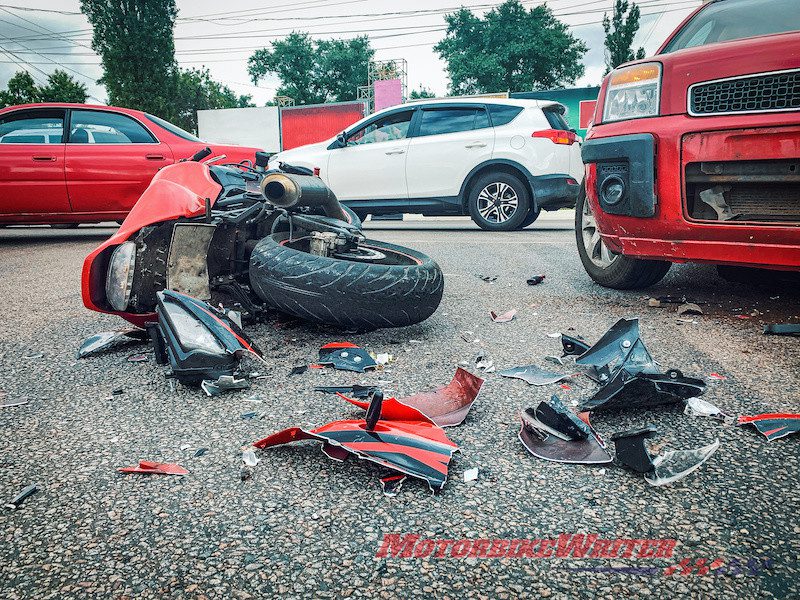
People love motorcycles because of their low purchase cost, ease of maintenance, fun and adventure. These machines, though, pose an extra risk to riders. Riders are more susceptible to injury and death due to the lack of protection in the event of an accident.
People involved in motorcycle traffic collisions can sustain long-term injuries such as a damaged spinal cord, fractured or amputated limbs and, in worst cases, death.
Below are some of the statistics you should know about motorcycle collisions.
1 Probability of Occurrence
The National Highway Traffic and Safety Administration (NHTSA) reports that motorcycle drivers were 27 times more likely to die in car crash per vehicle mile travelled.
In Australia, motorcycle registrations account for 4.5% of vehicle registration and 0.9% of total distance covered by vehicles. The low registration doesn’t correlate with the number of motorcycle accidents. Motorcycle collisions are responsible for 15% of fatalities and an even higher percentage of injuries.
So, despite the low numbers of motorcycles on the roads, the risk factors are high. Riders are also more susceptible to injuries and death than in any other category.
2 Helmet Use and Related Susceptibility Rate
Helmets and other safety gear offer additional protection and safety measures to riders. According to the World Health Organization (WHO), the appropriate use of helmets reduces fatal injuries by 42%. Helmets also prevent head injuries by a further 69%.
Data from NHTSA estimates that economic loss amounting to USD$3.5 billion was prevented and other related costs amounting to USD$21 billion were saved. These amounts and a further USD$1.5 billion could’ve been saved if every rider wore a helmet.
The total fatalities that were prevented by wearing helmets amounted to 1,872, and the other 750 could have been saved if they wore helmets.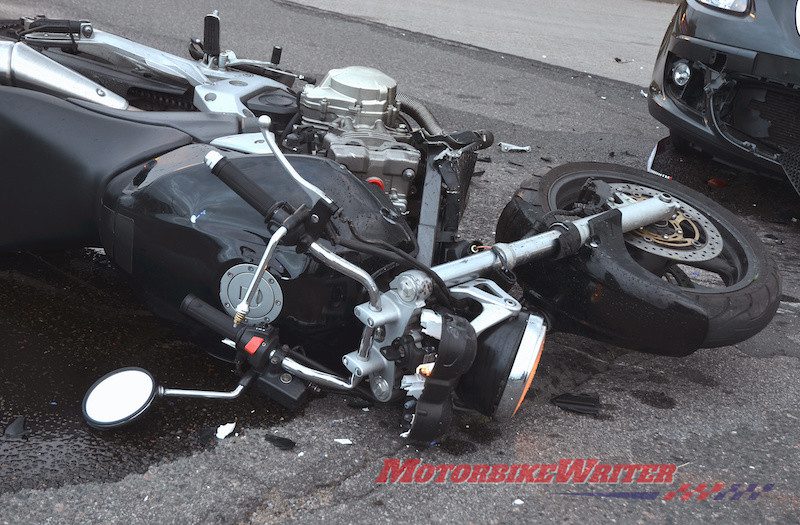
3 Statistics of Other Causes of Motorcycle Traffic Collision
One significant factor in motorcycle traffic collisions is the age of riders. In 2016, the majority of crashes and fatalities involved riders more than 40 years old. Also, in 2017, a third of the riders involved in road crashes were more than 43 years old.
In a report commissioned by the Ministry of Infrastructure, the contributing factors of crash fatalities are excessive speeding at 70%, alcohol and drug abuse at 46%, and learner riders at 8%. Sometimes, up to three factors are related to a single crash.
It’s important to note that it’s advisable to seek compensation for injuries resulting from these accidents. Consulting a motorcycle personal injury lawyer can help you investigate the causes, negligence, gather evidence, and negotiate with insurance firms or lobby for fair compensation in courts.
4 Motorcycle Injuries and Injury Rate
There have been oscillations between 2008 and 2018 injury rates in the United States–from a high of 96,000 in 2008 to a low of 89,000 in 2017. Also, there has been an outlier in that curve with 104,000 injuries in 2016 and 81,000 in 2011.
The trend is replicated in different metrics, like injuries per 100,000 vehicles registered, and miles travelled in millions and injury rate per 100m vehicle. The general observation is the general reduction in these trends.
For instance, the injury rate per 100,000 registered motorcycles reduced from 1,238 in 2008 to 1,018 in 2017, with a low of 965 in 2011.

5 Motorcycle Fatality Statistics
According to the Governors Highway Safety Association(GHSA), there were 5,000 motorcycle-related deaths in 2017, down 300 on the previous year. The report, however, noted a big representation of riders in total fatalities.
In comparison with other fatality sections such as passengers, drivers and pedestrians, motorcycle-related fatalities have had an upward trend in the past decade. A report prepared by the ministry of infrastructure shows a continued rise from 10% in 1998 to 15% in 2007.
The driver death per billion kilometres travelled indicated that more motorcycle riders died. There were 116.4 rider deaths per billion kilometres compared withy 4.3 driver deaths per kilometre in 1998. In 2003, 116.9 deaths were reported compared with 3.9 driver deaths. By 2007, a 116.9 death rate represented an increase compared with a decrease of driver deaths to 3.9.
These figures indicate motorcycle fatalities haven’t reduced as compared with a 2.0% decrease in driver deaths in the last decade.
The Department of Transportation reports that in 100,000 registered vehicles, 59.34% of accidents related to deaths involved motorcycles, in comparison with 7.52% for light trucks and 10.05% for passenger cars.
Conclusion
Motorcycle traffic collisions are prevalent and more likely to occur than other classes of vehicles, even though motorcycles are fewer on the road. On a positive note, there was a reduced number of injuries in the United States between 2008 and 2017.
Some of the causes of motorcycle injuries include helmets, alcohol abuse, age factor, and excessive speed. World Health Organization (WHO) notes that correct helmet use reduces susceptibility to injuries.