Although electric cars have recently made huge leaps in the motor vehicle industry, we will instead focus on personal light electric vehicles (PLEV). In this article, we cover the environmental footprint of several PLEV models, alongside aim to clarify any misconceptions regarding them. We will discuss the carbon/material outputs required to manufacture electric bikes, scooters, skateboards and hoverboards. Moreover, we take a look at the future of PLEV technology, including advancements in battery efficiency and streamlined production processes.
Read the differences between production in the USA, Canada and Europe, alongside their stance on electric vehicles altogether. Alternatively, view the laws and legislation surrounding PLEV law in the US, Europe or Canada here. Learn the average lifespan & waste produced by each of these vehicles, relative to other conventional methods of transportation; broken down into a 4 stage lifestyle and detailed below. However, we will first start with the manufacturing and distribution cycle.
 Via: WorldCultureNetwork
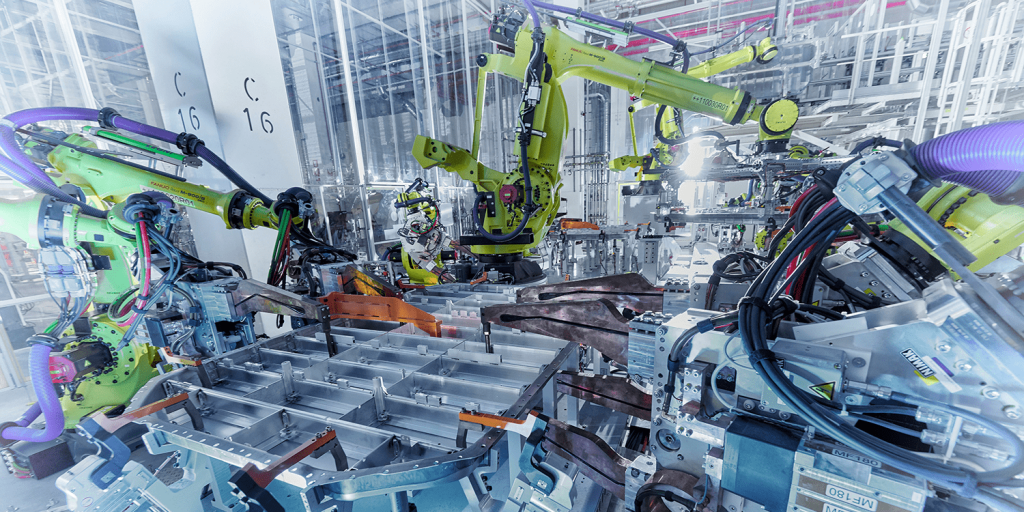
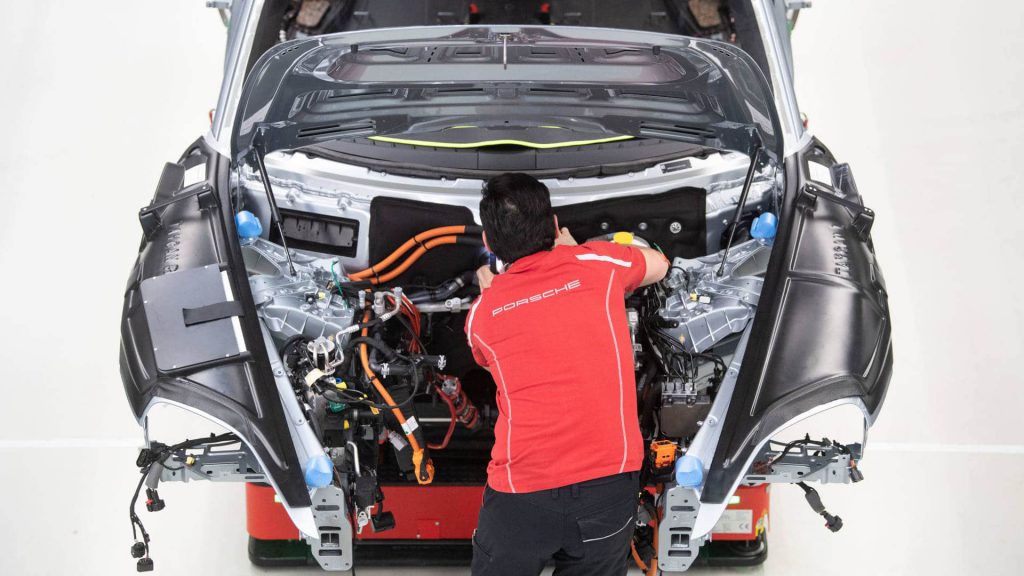
PEV Manufacturing, Materials, and Distribution
Battery Production (Li-ion)
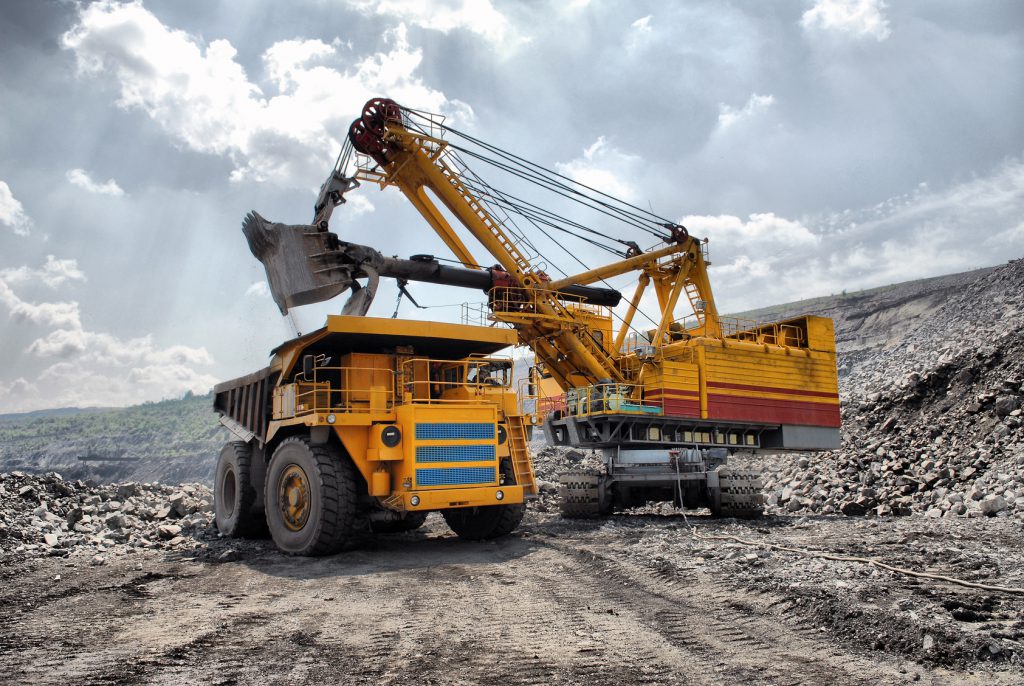
The most common trait shared between these PLEV models is their batteries. Almost all modern models listed incorporate lithium-ion (Li-ion) batteries within their design. These batteries are much more effective than their carbon counterparts, boasting a bigger capacity and longer lifespan. However, overall production costs and carbon emissions are much higher. The most pollutive part of the entire process is the actual mining of lithium from hard rock spodumene sources; averaging ~9t of CO2 per tonne of refined lithium carbonate.
 Via: Electrive
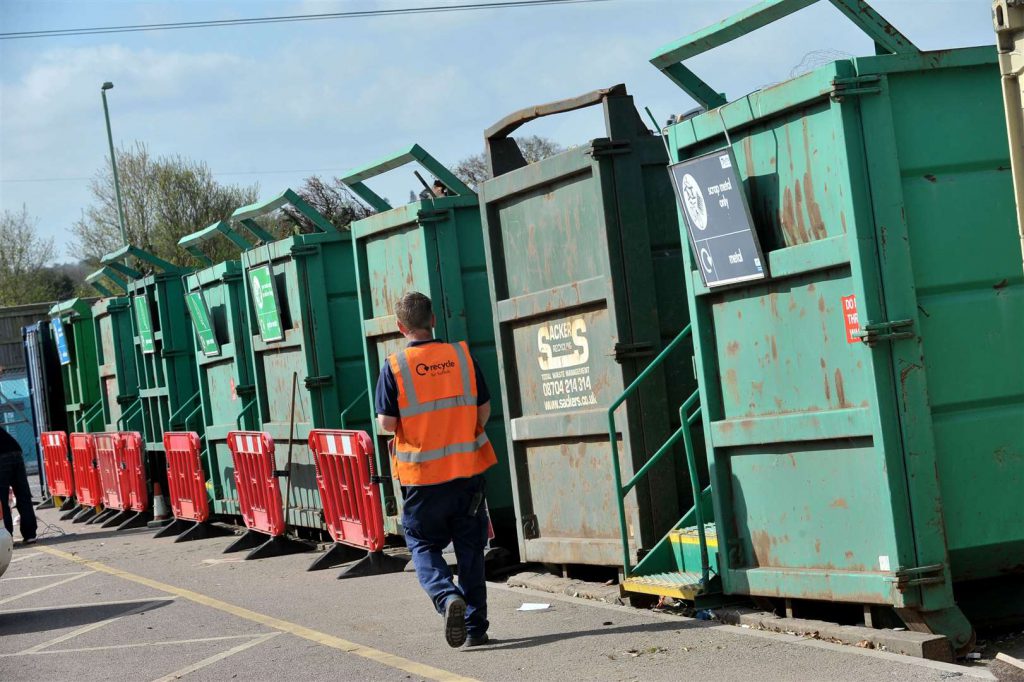
Thankfully, countries such as the U.S. have started recycling initiatives for Li-ion batteries. As lithium sees use in many devices (phones, laptops, etc.), it remains very valuable even after use. Currently, it’s cheaper to continue mining lithium than to recycle existing battery cells; although this is sure to change in the future, as electric vehicles become increasingly popular. For those within the United States, CALL2RECYCLE offer services relating to the disposal of both lithium-ion and NiCad batteries.
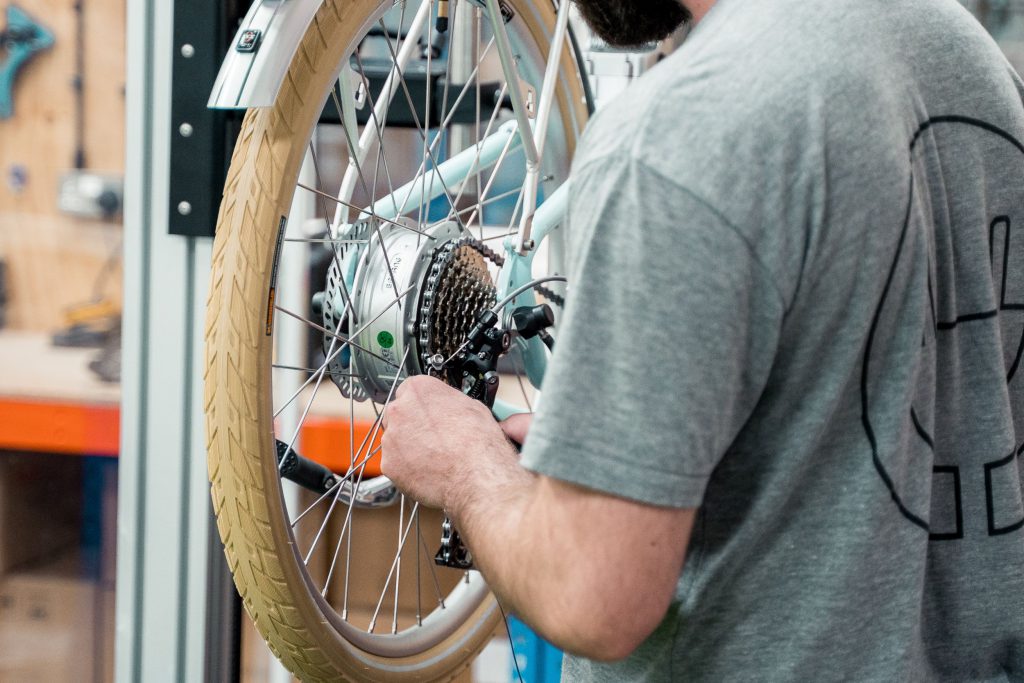
Electric Bikes
Interestingly, the increase in CO2e for eBikes is only marginal, in relation to normal bicycles. According to the ECM, bicycles offer an average lifespan of ~19,000km, with a total CO2e of 96kg throughout its use (approx. 5g per km). Surprisingly, eBikes running on 0.5kWh battery packs average a similar 7g CO2e per kilometre. However, the main difference between the two starts at assembly, with that previously mentioned 0.5kWh battery pack reportedly emitting 34kg CO2e just to produce.
 Via: ProQC
Other materials include metals used in the frame, most commonly aluminium alloy, steel or carbon. The average aluminium producer emits ~4.80 tonnes of CO2 per tonne of aluminium, although a single electric bike requires far fewer than a tonne. Even still, this is nothing when compared to cars, producing 68kg CO2e per kWh of battery capacity. Both figures remain dwarfed by the current cost of electric cars, with the Tesla Model S incorporating a 75kWh battery; producing approx. 5100kg CO2e per car.
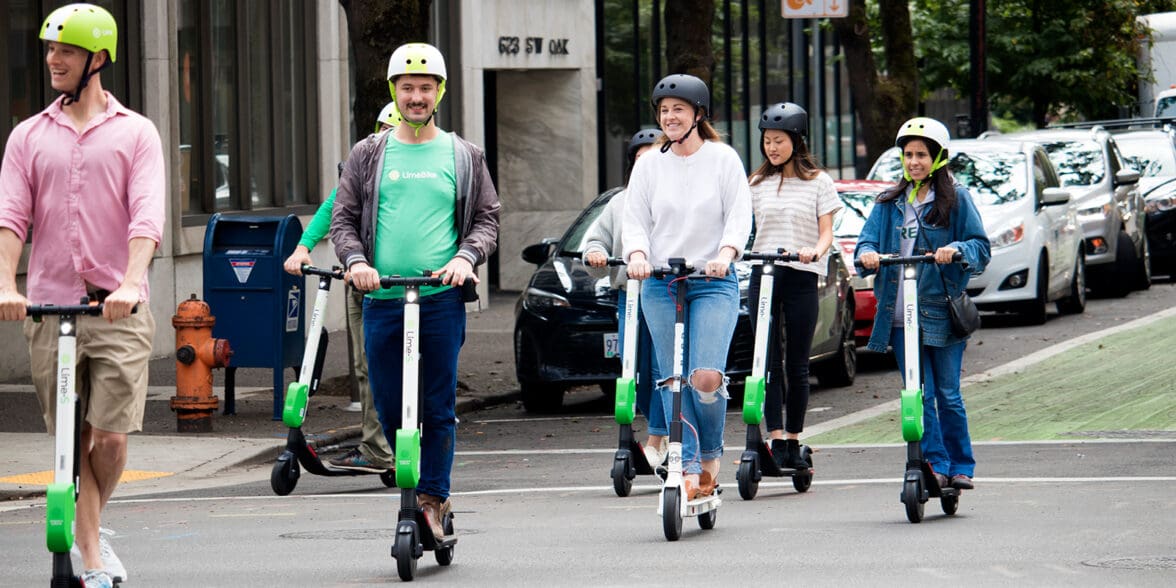
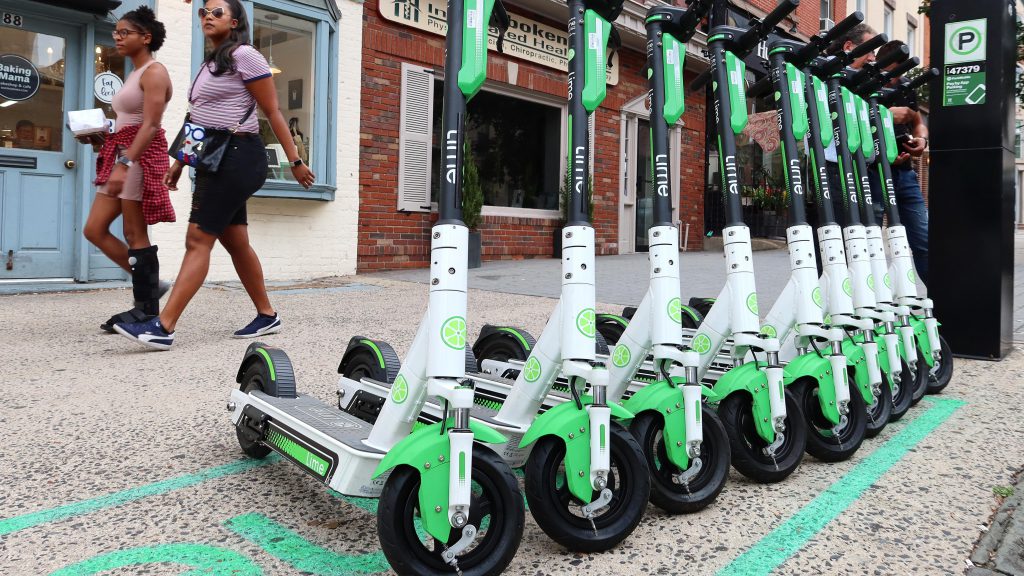
Electric Scooters
eScooters produce much less carbon throughout the ‘use stage’. However, the most pollutive part of production lies in the manufacturing process and use of lithium-ion batteries. Like eBikes, most models also utilise aluminium alloy and rubber for their materials, further contributing to their carbon footprint. One of the most significant aspects to consider is the way energy is produced in order to charge each model. If done so in a region with lots of green/renewable energy, overall CO2 and greenhouse gas emissions will prove much lower than traditional fossil fuels.
 Via: Youtube
According to a study published by North Carolina University, eScooters total ~202g per km of use. This is the same amount of CO2 per km as a typical car and x3.5 more than an electric car. Reportedly, 50% of the total carbon impact relates to production, with 43% of greenhouse emissions relating to recharging. Focusing solely on this ‘use stage’, we see that electric scooters and other PLEV models emit practically no CO2, excluding particles related to braking. As such, the longer eScooters see use, the more ecological they become. This is detailed under our “overall energy efficiency in use” section.
Electric Skateboards
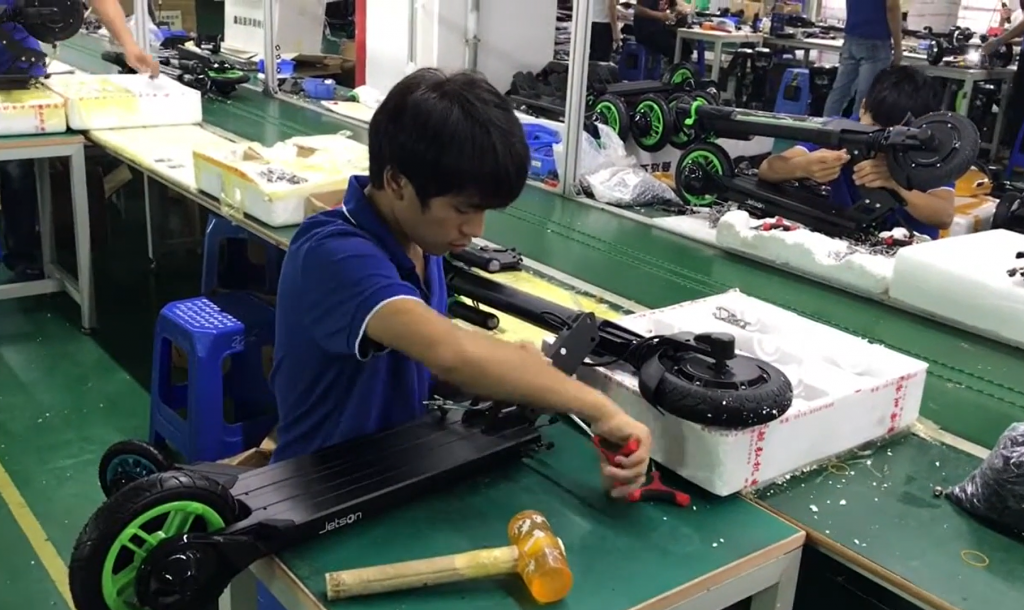
Whilst utilising the same lithium-ion based battery as other PLEV models, wood is a unique material to consider. Since 1990, maple wood proves the most prominent raw material used throughout skateboard manufacturing. Research suggests that at least 100,000 skateboards leave production every month. This implies that maple tree deforestation has increased throughout this time period, especially as they take between 30-80 years to reach maturity.
 Via: Youtube
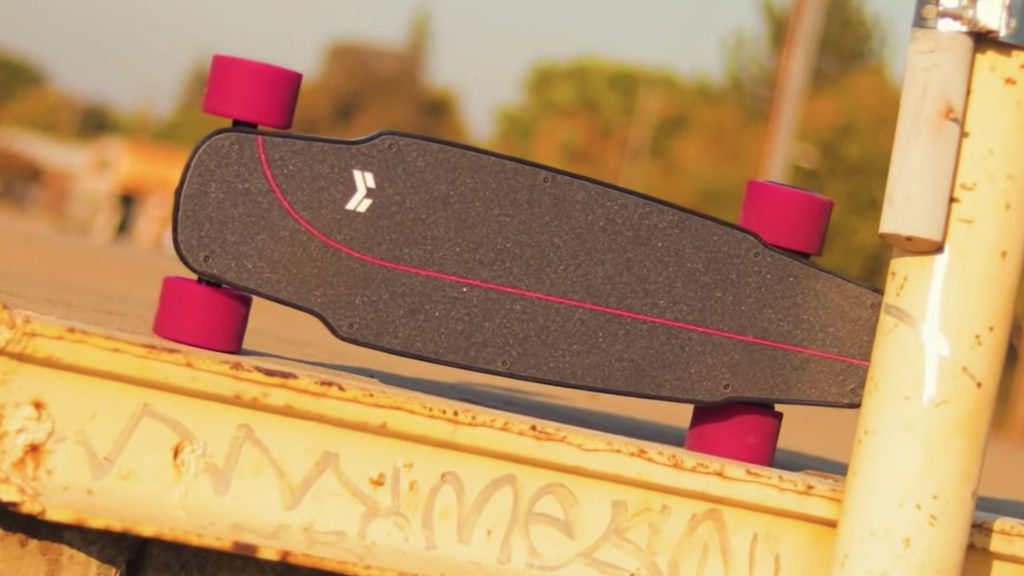
Despite this, we cannot conclude whether this demand for maple outweighs the emissions caused by using aluminium alloy in frames for other PLEV models. ‘Mellowboards’ calculate that the average German skater emits ~2.4g of CO2 when riding one of their boards. Whilst we have no official CO2e figures relating to eBoard production, it’s clear that they must cause some emissions; most likely stemming from the logging/deforestation stage.
Moreover, glues, grip tape, epoxy resins and other pigments used in creation release chemicals and other emissions if burned. Manufacturers often use alloys to produce the trucks of these boards, which are very rarely reusable and made by casting; further releasing carbon and other emissions. Actually, most components of an electric skateboard currently prove difficult to recycle, including the battery. We hope to see more eco-compatible models in the future, so for now, we wait patiently!
PEV Carbon Footprint
Electric Bikes Carbon Footprint
So let’s not kid ourselves, eBikes remain much more eco-friendly than current electric cars. Riding an eBike creates just 2.5 – 5 grams of carbon dioxide per mile, whereas electric cars produce at least 150 grams per mile. According to the ECF, the average eBike consumes 23Wh of electricity per kilometre. This figure is then multiplied by the average amount of CO2e produced per Wh (0.383 g CO2e per Wh in Europe); leading to an estimated average of approx. 9g of CO2e per kilometer of use.

Considering energy efficiency, this rate of consumption would result in mileages of just ~20km for a 500Wh eBike, which we feel is a bit too low. From our experience in testing and reviewing electric bikes, a 500Wh battery usually offers ~60-90 km of use per charge, in optimal conditions. Of course, it’s important to consider the energy production efficiency in various regions. For example, figures from the UK government suggest a much lower carbon cost than most of Europe, averaging just 0.256g of CO2e per Wh generated.
Electric Scooters Carbon Footprint
Firstly, if we look at mass-produced electric scooters in cities, a number of issues immediately arise. The first problem is charging, with many hundreds of scooters requiring transportation via lorries, trucks and other HGV’s for miles. As previously mentioned, recharging doesn’t produce many emissions; provided that the region utilises green methods and renewable energy sources. However, very few regions place full reliance on renewable energy, which we hope to see change in the future. More unfortunately still, electric scooters only have an estimated average lifespan of around 1 year, which is terrible considering the production costs involved.
In comparison to cars, who average around 150,000+ miles before breaking down, an average city eScooter sees just a few hundred miles of use before disposal. Sadly, we see plenty of vandalised and destroyed electric scooters in cities over the world, which further boosts their carbon footprint. In order to offset their high impact from production, they must see use for multiple years. Even after the first two years, they still produce an average of 141g of CO2 per kilometre, per passenger. However, in cities such as Louisville and parts of London, they barely last a month.
Electric Skateboards Carbon Footprint
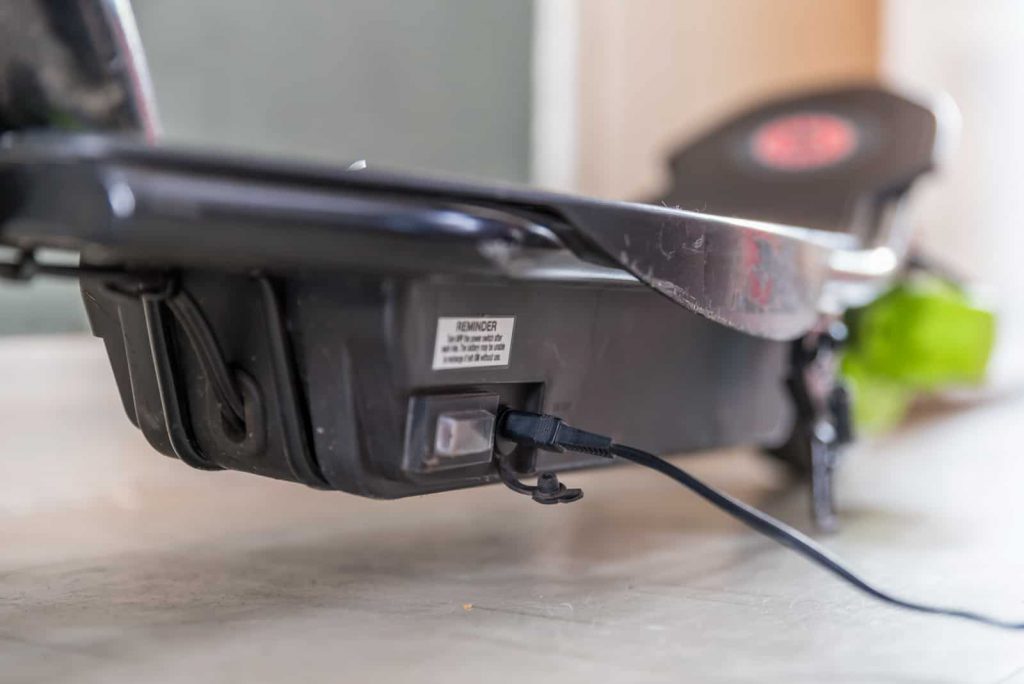
Once fully produced and in use, electric skateboards produce very few emissions. In fact, many eBoard brands market themselves as “zero emissions” entirely; even moving on to more environmentally friendly materials for their decks, such as bamboo or recycled rubber. Some manufacturers like ‘Satori’ request their customers to return used and worn-down wheels and trucks, which are promptly recycled to make new ones. This prevents the additional carbon cost of forging new trucks, or any mining and transporting of metals.
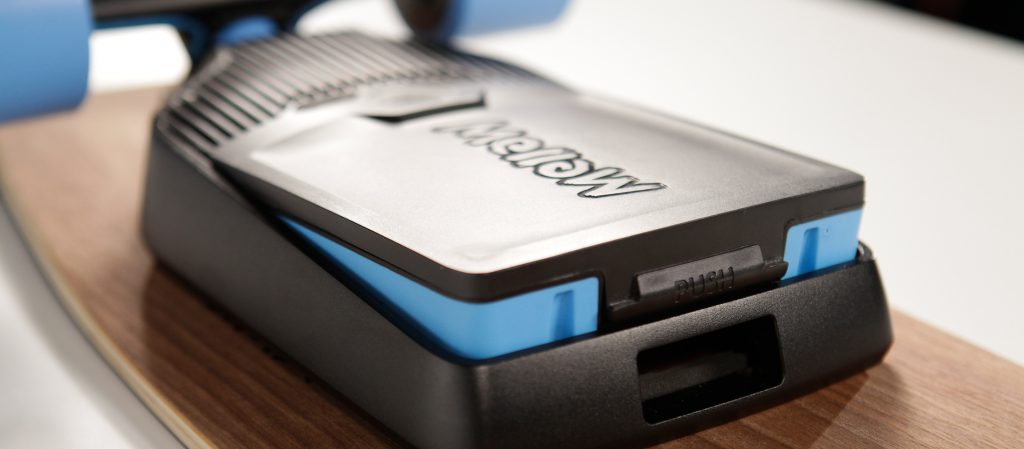 Via: MellowBoards
From what we know, most post-production emissions come from recharging. Total carbon cost from this remains dependent on battery capacity and the amount of green energy available in your region, with the USA, Canada and Europe discussed below.
Overview
Despite remaining the most costly component of all PLEV models, lithium-ion batteries can still be maintained easily enough. If you take care of your electric vehicle, expect your battery to last at least 3-5 years, or approx. 300-600 charge cycles. Most 500 kWh models require only 4-6 hours to fully charge, for an average cost of ~25 cents. It’s even better if they’re recharged using clean, renewable energy, which would further reduce carbon emissions from use. As such, we’ve compiled a section comparing current renewable energy statistics between the USA, Canada and Europe.
 Via: Longdown EIC
USA
In the United States alone, electricity generation emitted a total of 1.72 billion metric tons of CO2 (or 0.92 lbs of CO2e per Kwh). This is a concerning figure, especially when you consider that the US isn’t even the top producer of carbon emissions. Thankfully, there is currently a big push towards carbon neutrality and renewables sources of energy.
We were relieved to learn that renewable energy is the singular fastest-growing energy source within the U.S, exploding by over 100% between 2000 and 2018. In total, renewables accounted for approx. 17% of net electricity generation within the U.S. There has been a strong initiative to foster a variety of carbon capture and green energy companies. The main sources of renewable energy come from hydropower (7%) and wind power (6.6%).
 Via: Travel Nevada
These figures aim to rise to over 45% by 2050, which is still quite a long way off. So in today’s world, eco-friendly practice really relies on your region’s power grid. Some states such as Vermont have decided to push for renewables early, whereas others have avoided them altogether. Once only clean, renewable energy is utilised, PEVs will produce practically no carbon throughout their use cycle.
Canada
In 2015, Canada emitted approx. 722 million metric tonnes of CO2, with 10.9% as a result of electricity generation. Despite emission levels remaining fairly huge on a national scale, Canada has already taken big steps towards clean energy. In 2016, 80.6% of electricity in Canada was generated from non-emitting sources. Just a few years later in 2018, their global share decreased to just 1.5% of total worldwide carbon emissions. Despite utilising non-emitting sources, renewable energy only accounts for approx. 18.9% of Canada’s energy supply, with hydroelectric sources making up the bulk of this figure.
 Via: grist
As it stands, charging and using PEVs is almost already carbon-free throughout most of Canada, which is a big boost. Their government has also set even higher goals than the U.S, aiming to increase zero-emission power sources up to 90% by 2030 alone. This is all whilst remaining one of the world leaders in renewable energy production, so we have high hopes for the future of electric vehicles in Canada. Read about the current PEV and eBike laws in Canada here.
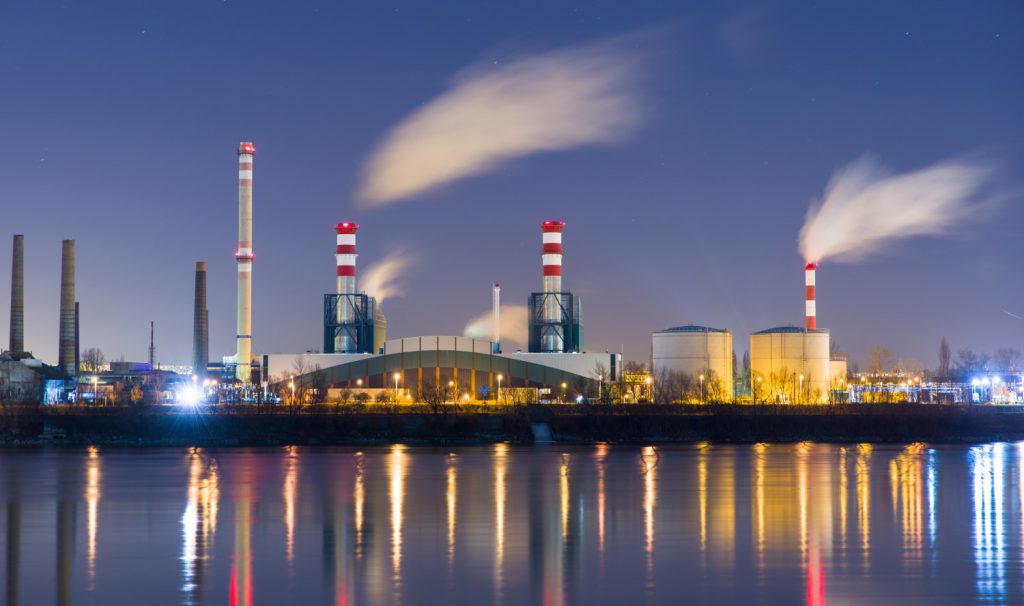
Europe
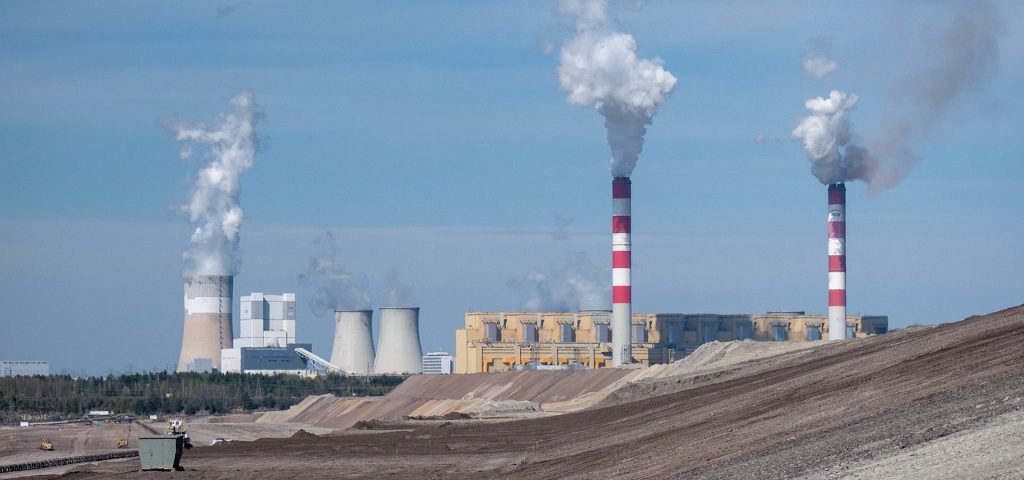
For simplicity’s sake, we will first focus on countries within the European Union. Collectively, all of the countries within the EU produce a total of approx. 2.54 billion metric tons of CO2e; 13% less than what was reported in 2019 Out of all member states, Germany has consistently produced the most CO2 emissions since the start of 2000; producing ~605 million metric tons of CO2 in 2020 alone. Although Germany must change soon, overall greenhouse gas emissions within Europe have been steadily decreasing since 1990.
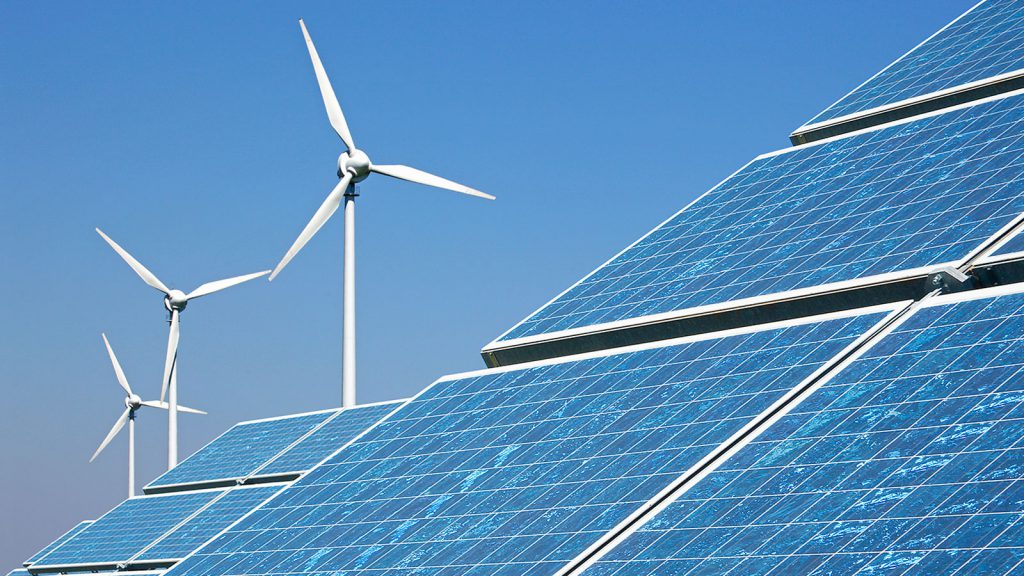
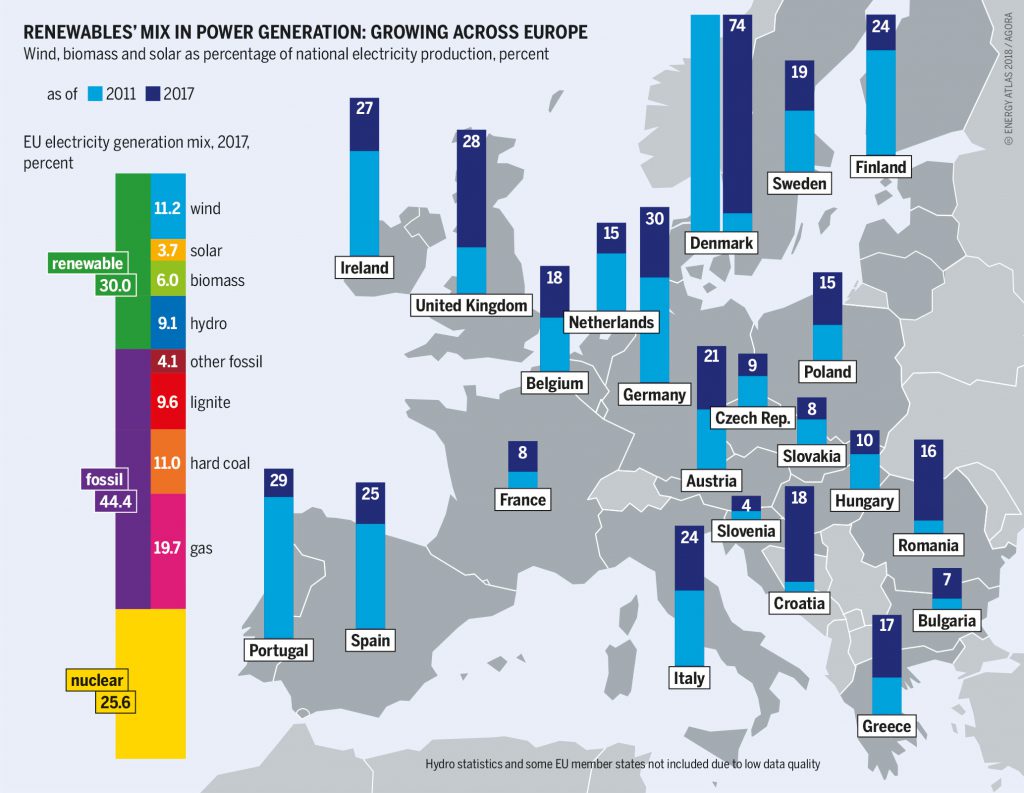
Renewable energy consumption reached approx. 19.7% of all energy generated within the EU-27, showing a clear increase from the 9.6% reported in 2004. Currently, the leaders of renewable energy within Europe are Sweden, with approx. 54.6% of all energy in the country is generated from renewable sources. Sweden is then closely followed by Finland (41.2%), Latvia (40.3%), Denmark (36.1%) and Austria (33.4%).
The United Kingdom also stands at slightly above-average, with 40.2% of its total energy sourced from renewables, as recorded in December 2020. Whilst we feel is a good start, they currentlyl have absolutely nothing on Canada. Therefore, recharging your PEV model in most countries throughout Europe is not completely carbon neutral. Despite this, we are seeing a growing market for renewable energy, so we eagerly the future. Click and view the current laws for PEV and eBike in Europe, or continue reading for our lifespan and waste comparison section.
 Via: Friends of the Earth
PEV Lifespan & Waste
Comparison to Other Modes of Transportation
Whilst nothing beats the bus or a relaxing walk, it’s important to compare the emissions for each method of travel. This helps us identify and favour the most eco-friendly choice for our morning commutes or shopping trips. Continue reading to learn the PLEV life cycle, including the difference in emissions between conventional cars and PLEVs.
 Via: NY Times
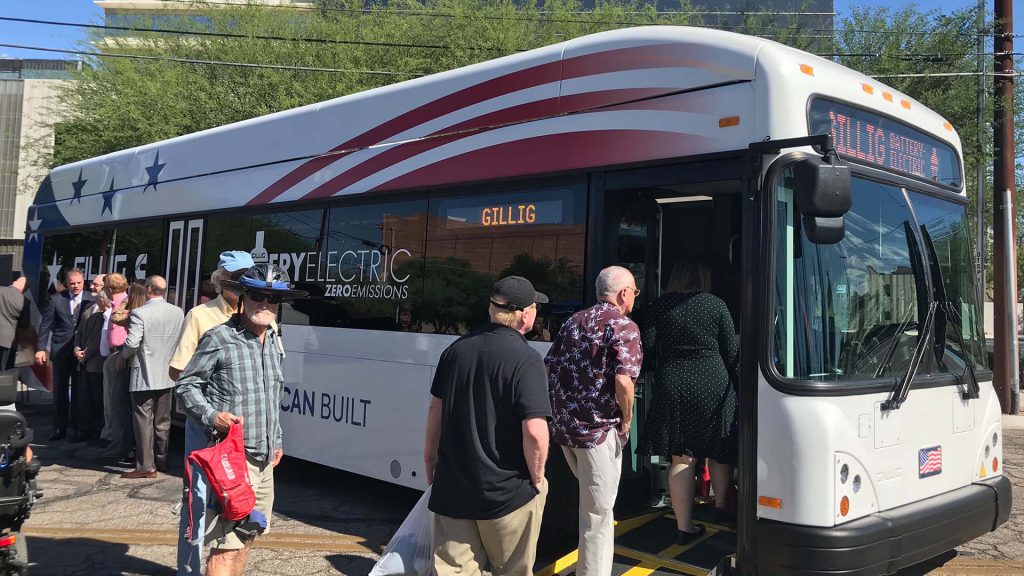
Let’s begin with buses, which become more eco-friendly with the more passengers they transport. There are a number of things to consider for every vehicle, from construction and assembly to fuelling and even roadside maintenance. The average CO2e rate for a full bus is ~822g – 1.3kg per kilometer, accounting for every passenger. This is still much better than conventional cars, especially considering that every passenger would otherwise be required to drive their own. The average coach is even more efficient, emitting just 27g per kilometer of use, much lower than the 180g released by cars, or the 115g released by motorbikes.
Quite a drastic difference compared to the 5g per km from eBikes, or the 2.4g emitted from riding an electric skateboard! However, as discussed under carbon/material use and manufacturing section, electric scooters actually cause as much CO2e as a typical car throughout production. With assembly causing the most emissions, we insist that riders try their hardest to maximise the lifespan of their ride; as long-term use can eventually offset this carbon footprint. The average electric scooter lasts 1 year to just a single month in some cities, which is far lower than the required length of use to reach neutrality.
A Long Way In 5 Years
So with technology is ever advancing, these electric vehicles will only become more efficient. For example, it was just 5 years ago that hoverboard batteries were exploding during use; a tale now nearly unheard of since then. However, we still recommend the carbon-conscious to take the bus over their own car, PLEV or taxi; unless you live in an area with a high availability of renewable energy. If you decide to start using a PLEV, take good care out of it and aim for at least 3+ years of use. Learn more about the PLEV life cycle below, or learn how to maintain your eScooter here.
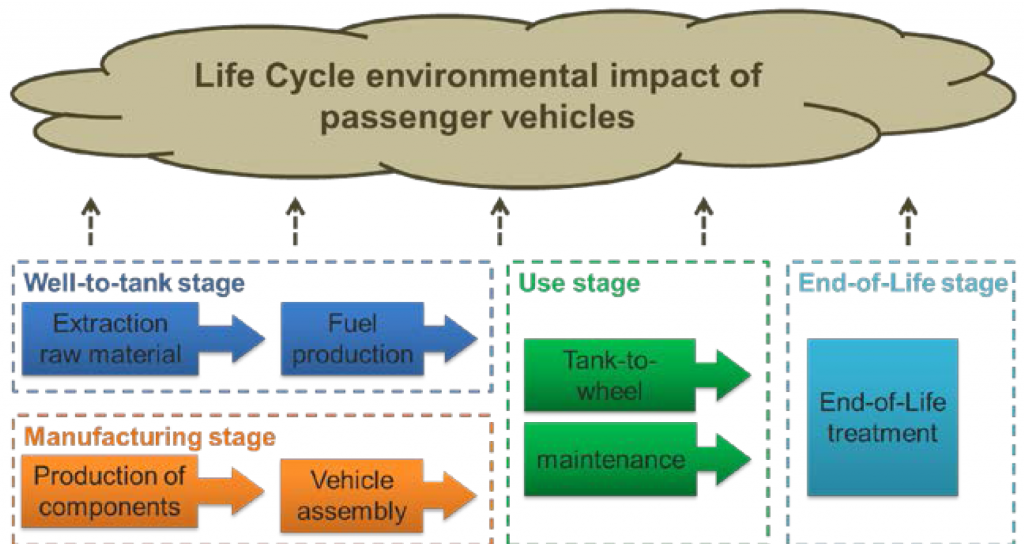
PLEV Life Cycle (4 stages):
Vehicle Manufacturing, Assembly, Vehicle Use, End of Life/Maintenance.
 Via: MDPI
Stage 1 (Vehicle Manufacturing):
What is required to start production and what does it cost?
Relating to the energy consumed to extract and transform raw materials into components. As indicated by previous parts of our article, vehicle manufacturing is one of the most polluting parts of production. This predominantly comes from the extraction of resources and how they’re used. For example, lithium must first be mined and transported. For cars, producing a similarly sized electric battery emits up to 74% more CO2 than traditional fossil fuels.

These batteries can require other metals, such as nickel and lead. Rubber, aluminium and other materials also contribute to the total emissions produced, although battery production remains the most polluting stage by far. Currently, electric scooter manufacturing causes the highest carbon output, especially when considering how many rideshare models last just 1 year or less.
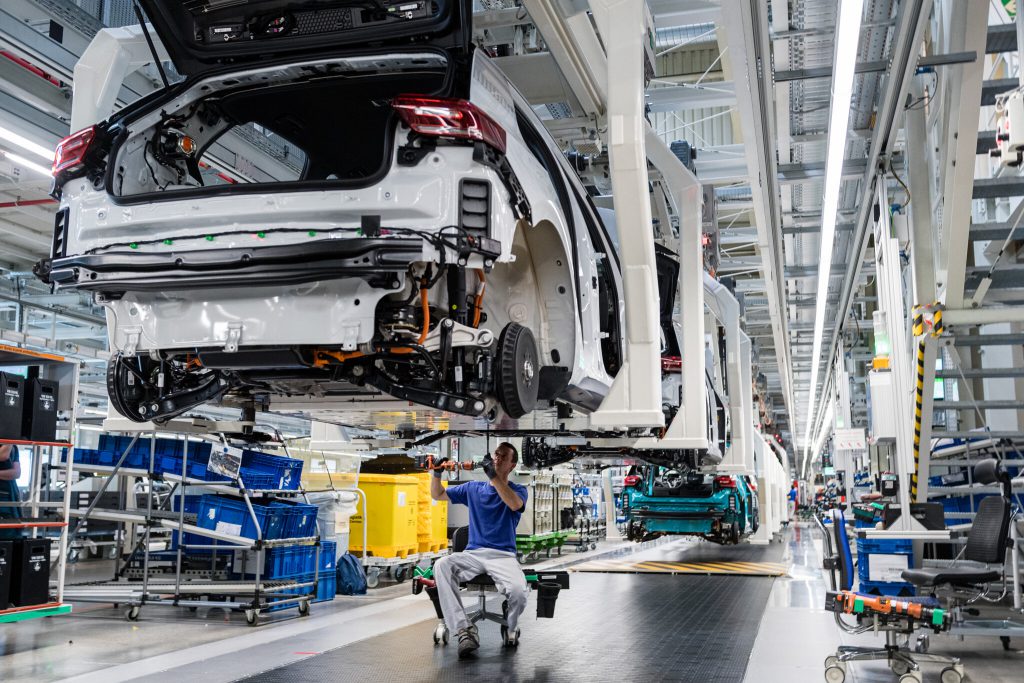
Stage 2 (Vehicle Production):
How much CO2 is emitted from producing these vehicles?
This section brings into question how much pollution is caused creating the energy required to power each vehicle. For example, ecological methods of energy production (renewable or decarbonated energy) will have a lower environmental impact. Fossil fuels (coal, oil, gas) will release greenhouse gases at a greater rate, especially after factoring use over time.
 Via: NY Times
Most models utilise a 0.5kWh battery that, whilst claiming a high carbon production cost, releases only 7g CO2e per kilometre of use. Despite that, this seemingly small battery still costs 34kg of CO2 just to produce, remaining the most pollutive part of any PLEV model covered in this article. Excluding battery production, electric scooters firmly remain the most carbon demanding models to produce, operating at ~202g of CO2e per kilometre; around the same as a petrol-based car!
In comparison, a typical petrol-based car emits ~4.6 metric tons of CO2 per year and approx 120.1g per kilometre. This is significantly higher than electric cars, which contribute just 33 grams of CO2e per kilometre; although have a much higher production cost. These production costs are offset through long-term vehicle use, discussed in our next stage.
Stage 3 (Vehicle Use):
What are the costs and emissions related to using these vehicles over time?
Possibly the most significant phase in an electric vehicle’s lifetime. PLEV models do not conventionally pollute or produce emissions during use, with only particle emissions relating to braking. These electric vehicles start with fairly high emission outputs from production, however long-term use of these vehicles eventually offset this; becoming more ecological the longer they’re operated. The only cause of CO2e is related to charging, which is offset by clean/renewable energy practices.
 Via: Bicycling
However, acknowledging battery efficiency and lifespan is still important. Some ride-sharing scooter companies have their eScooters picked up and transported to a charging station by trucks/lorries or freelancers; which will also have a considerable impact on their eco-footprint. Despite having the highest carbon costs to produce, electric scooters also claim the shortest lifespans. Many within cities are lucky to last 1 year, or even 1 month, as a result of neglect or vandalism.
Stage 4 (End of Life/Maintenance):
How it is maintained and recycled or destroyed when it no longer works?
Due to the use of the most optimal materials throughout manufacturing, rare and high production cost components may be discarded. As such, countries and communities alike must adopt stringent recycling habits in a safe and effective manner. Most importantly is to appropriately deal with batteries, as they clearly cause the most pollution throughout production and use.
Luckily, the frame of most electric bikes, scooters and skateboards remain usable without a functional battery or motor; although can prove quite a bit heavier than traditional models. Repair and maintenance for these models are also straightforward, with riders easily able to replace motor hubs, batteries, wheels and other components; which is especially easy for eBikes.
Unfortunately, there are no mainstream recycling methods for hoverboards, with only a handful of vendors offering repairs and refurbishments. Most of these hoverboard models still see landfills, which is bad but arguably better than when they used to just explode. Hopefully, we will see great leaps in battery recycling services and technologies to make these electric vehicles even greener!
Conclusion
It’s rare that anything we buy is carbon-neutral, even if they produce no emissions in practice. There are so many factors to consider before anything is truly neutral. For example, many fail to consider how their diet can contribute to CO2 emissions, even when riding a traditional bicycle or running. These subtle factors can lead us to regularly pollute without even realising it. Therefore, it’s difficult to weigh up all the pros and cons, from production output/emissions and single use to transporting multiple people and recharging.
 Via: The Times
However, the importance of renewable energy and recycling services remain clear. Whilst electric vehicles need some work to become truly emissions free, they are still a great start. They will surely catch up to modern standards and only become more and more efficient, so stay vigilant. We hope we helped clarify the impact/environmental footprint related to electric bikes, scooters, skateboards and more. Please leave us a comment if you have any questions or want to share your opinion!
Alternatively, read the latest PEV news here.
Extra sources:
https://www.bikeradar.com/features/long-reads/cycling-environmental-impact/
https://youmatter.world/en/sustainable-mobility-electric-scooters-28897/